Welcome To Malaysiafutures.com

Stay tune for more recent Futures market updates on news and various in depth analysis.

You Ask For It, You Got It !!

Yes, you heard it right. Traders can now access to both local and global equities market right at your fingertips !!

Bursa Gold Futures Is Now Available !!!

Get ready for ultimate all in one trade station, trade FCPO, FKLI and the new FGLD (Gold Futures) under the same user friendly platform. Click for more !!

Foreign Futures Is Available

Expand your trading portfolio to foreign market, ranging from HKFE, CBOT, NYSE, NYBOT. SGX, EUREX and much more utilizing J-Trader by Patsystem™.

Fully Online Trading Platform

Trade Malaysia Futures contract with full confidence with real time data stream online, no re-quotes, no delay anywhere. Call 03-7717 3290 today !!

Showing posts with label FKLI and FCPO Market Outlook.. Show all posts

Monday, October 5, 2015

FCPO: Calm Before The Storm

FCPO: Looked At How Far We Have Arrived


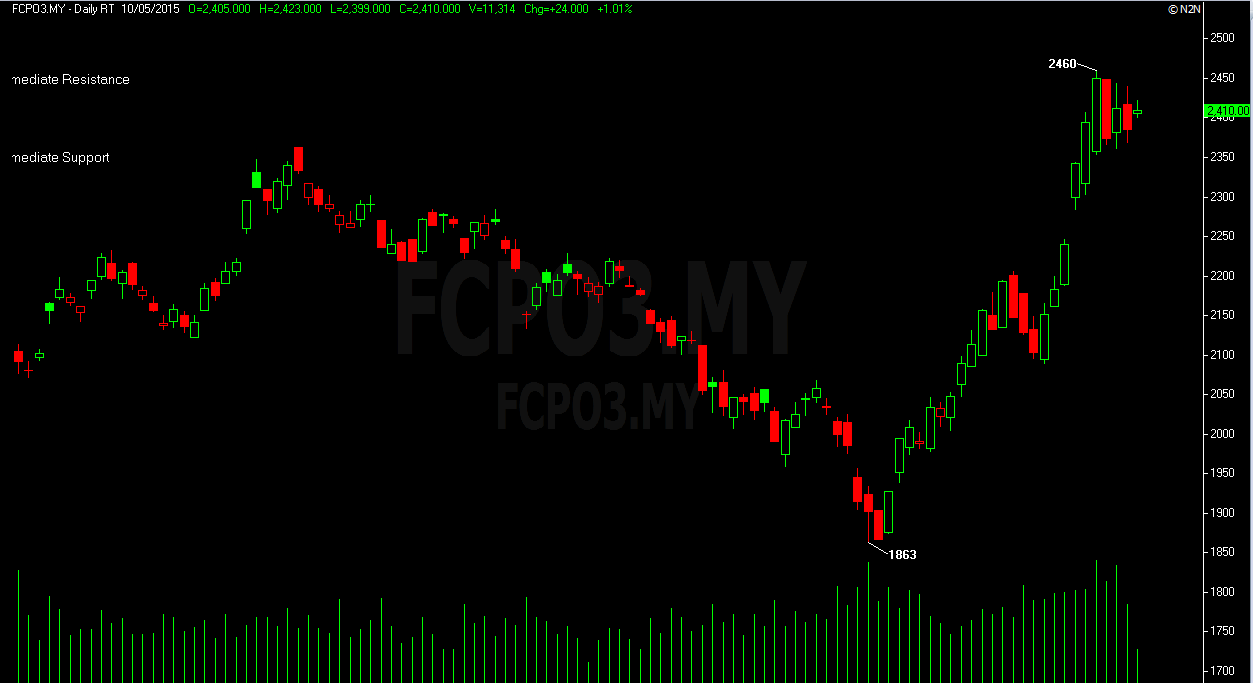
Palm oil futures had it most outrageous move ever since two years ago. The benchmark month is making serious range day after day starting at the mid of third quarter and now it might be showing some sign of slowing down, maybe. The benchmark month significant rally from 1863 level was an astonishing achievement for those who did not believe market can take form of any formation. No one can tell when is the market is going to peak nor whether it is recovering from a bottom, no one. One things that remain constant was, news will be Bearish when the price headed down for some time, and news will be very Bullish when the price has moved or recovered more than it should. The point is, there is always a lag between news and price. Very smart traders will use news to manage their positions. Well, mostly these types of traders do have strong opinion and we know what happen for those who have opinion and plan to stick with it. Deep pocket was part of the pre-requisite to have any opinion, ego and strong language came after that. I have high respect and jealous for those who have opinion in the market and their ability to withstand pain when the price goes against them. Back to the market outlook, there are some hesitation on the recent high after the Dec contract retrace slightly for some profit taking. It seems that the price is forming small triangular shape at current price. It is a concentrated price range waiting to be burst out. Judging from historical price action, two or more session that ended with hesitation at current high is likely mean the Bulls are likely giving up but there is also a fair chance that the Bears are not gaining any advantage over the Bulls either. In another words, it is likely that this hesitation will continue to extend its sideways price action unless the price break off new previous high or major support.

 Disclaimer: Information and opinions contained in this report are for educational purposes only. While the information contained herein was obtained from sources believed to be reliable, author does not guarantee its accuracy or completeness.

Friday, March 20, 2015

FPCO: Swift Come Back For Bulls 18th March 2015

Thursday, 18th March 2015.  Palm oil futures for Jun contract went up substantially after hitting 2,128 level, Soy oil did provide some assistance by recovering on the Asia trading session. Other news to follow.


FCPO- It Would Not Be A Straight Line Recovery Nor Down Trend


Every time the market moved substantially, it will caught most traders off guard, always. You can see it when the market move substantially, it kept on heading to the same direction with force behind and most traders who does not re-act will be caught off guard. And when these traders realized it has to bite the bullets and exit, it will be a painful losses to bear. This is what happen every time the market move, it does not matter where does it move, move up or down, sideways, it doesn.t matter at all. The point is, price will sometime kept on breaking the support and resistance because there are alway traders getting caught off guard, those traders have to force exit their positions to stop from bleeding. There is always some poor bastard caught off guard when the market moved, and they can give you even the most ridiculous reason why they cannot re-act. Back to market outlook, FCPO Jun no doubt manage to recover most of its this week losses. And the Bulls did it with style, the Jun contract went up about a whopping 2.48% higher to settle at 2,193 level yesterday. There is no deny, Bulls were present yesterday starting from the beginning of afternoon session. What lies next might be the first immediate resistance level around 2,220, and if this level is taken out, short term outlook may return to sideways. Currently the Bears are still holding the trump cards for the moment, but all this can change if the price kept on recover above 2,220 level this or early next week. However, there are a few short term concern that might curb this recovery, steady slow down on palm oil export, soy oil and crude oil were generally still on Bearish trend in both short term and long term. For today, support for the Jun contract is located around 2,149 while ressitance is pegged at 2,237

Daily Pivot Point
R2= 2237
R1= 2215
S1= 2149
S2= 2105
 Disclaimer: Information and opinions contained in this report are for educational purposes only. While the information contained herein was obtained from sources believed to be reliable, author does not guarantee its accuracy or completeness.

Thursday, March 5, 2015

FCPO: Palm Oil Retrace From 2,400 5th March 2015

Thursday, 5th March 2015. Palm oil futures dive down after hitting 2,400 for the benchmark month, maybe the ship has sailed too close to the shore and hit some rocks. Other news to follow.

"-U.S. stocks declined for a second consecutive session on Wednesday, sending the S&P 500 to the lowest level in two weeks. Investors remained cautious ahead of the closely watched official jobs report, due on Friday, amid mixed economic data this week. Private-sector employment data on Wednesday showed continued gains in February but at a slower pace than in the prior month. Meanwhile, a gauge of activity in the services sector edged up last month. The S&P 500 SPX, -0.44% closed 9.24 points, or 0.4%, lower at 2,098.54. The Dow Jones Industrial Average DJIA, -0.58% dropped 106.41 points, or 0.6%, to 18,096.96. The Nasdaq Composite COMP, -0.26% ended the day down 12.76 points, or 0.3%, at 4,967.14."

"-Hong Kong stocks extended losses Wednesday, as markets cautiously wait for China to reveal its major economic programs and targets for the year.
The Hang Seng Index HSI, -0.96%  closed 1% lower, while the Hang Seng China Enterprises HSCEI, -1.73%  , which tracks Hong Kong-listed mainland Chinese companies, was down 1.7%."

"-Oil futures settled higher on Wednesday even though the U.S. government reported a much bigger-than-expected increase in weekly crude supplies. Analysts said prices likely found support on the heels of Saudi Arabia's decision to raise prices for its Arab Light crude and comments from the country's oil minister - both of which implied growing demand for oil. April crude CLJ5, +0.19% rose $1.01, or 2%, to settle at $51.53 a barrel on the New York Mercantile Exchange."


FCPO- Impending Correction


2,400 was a panic button for most traders previously, it is where the implementation of export tax if the price went above this level. Even tho the government has decide to extend the zero cost export tax, most traders still think 2,400 was too hard to penetrate. You all saw it yesterday when the benchmark month just touch 2,400 level and boooom, start retracing from that level. To make matter worse, price went haywire from 2,382 level and below, jumping down to 15 points lower straight. Few lots were done between that, but most stops were done at 2,365 level. Yes, it is a vicious vacuum, things happen all the time, you can blame it to the market depth, no Buyers standing by or anything you can come up, it is pointless anyway as things already happen. The best action would be charting the next steps you need to take. As a trader, one must be prepare for anything, market vacuum is one of it. Back to the outlook, yesterday significant correction may signifies first sign of weakness. It may not look much on daily chart but when you zoom into intraday chart, it become clearer that there is huge rejection from 2,400 and the May contract does ended around the low of the day. To make things worse, Soy oil dipped to 32.28 cents as the time of writing compare to 32.85 cents on yesterday 6.00PM. Now there are news that pointing at lower production cycle for this year and this event may eventually reduce stockpiles but that news is too subjective for me to make any decision of any form in the market. Yes, dumb the news please, it got nothing to do with me, at least. For today, pivot support for the May contract is located around 2,327 while resistance is pegged at 2,373.

Daily Pivot Point
R2=2419
R1=2392
S1=2346
S2=2327
 Disclaimer: Information and opinions contained in this report are for educational purposes only. While the information contained herein was obtained from sources believed to be reliable, author does not guarantee its accuracy or completeness.

Wednesday, February 11, 2015

FCPO: 2,400 Level Export Tax Curb Palm Oil Recovery 11th Feb 2015

Wednesday, 11th Feb 2015. Palm oil futures is still playing its little upward and downward swing, in a good way I presume. Other news to follow.


"- U.S. stocks rallied at the end the day Tuesday, sending the benchmark S&P 500 to its highest close this year, during what was another characteristically volatile day for equities. Investor optimism was fueled by hopes that embattled Greece and its creditors are nearing a compromise to avert a default, even though both sides continued to reiterate statements that suggests an accord is far from imminent. Earlier in the trading session, European and U.S. equities got a boost after news reports offered hope that the European Commission was considering a six-month debt extension. However, investors remained optimistic even though rumors of an extension were dismissed by Germany’s finance minister Wolfgang Schäuble. The S&P 500 SPX, +1.07%  closed 21.84 points, or 1.1%, higher at 2,068.58 and turned positive for the year. Nine of the 10 main sectors finished higher, while energy-sector stocks ended with modest losses, following a drop in oil prices. The Dow Jones Industrial Average DJIA, +0.79%  jumped 139.55 points, or 0.8%, to 17,868.76, with 26 of its 30 member ending with gains. The Nasdaq Composite COMP, +1.30%  added 61.63 points, or 1.3%, to 4,787.64, helped by a big gain in Apple, Inc., the heaviest-weighted component in the tech-laden index."


"- Hong Kong stocks saw their earlier losses melt away and closed marginally higher at the close of Tuesday’s trading. Data showing China’s consumer-price inflation at its lowest in five years, was balanced by news that the Chinese central bank had injected liquidity into the markets helping the sentiment. The Hang Seng Index HSI, -0.06%  ended in positive territory, up less than 0.1%."
"-Crude-oil futures fell more than 5% Tuesday to their lowest settlement level in nearly a week as concerns about a persistent supply glut resurfaced ahead of weekly U.S. inventory updates. Light, sweet crude futures for delivery in March CLH5, +1.48%  on the New York Mercantile Exchange fell $2.84, or 5.4%, to settle at $50.02 a barrel. That was the lowest settlement level since Feb. 4."


FCPO- Bulls Have To Wait Longer


Palm oil futures would be running its course of direction downwards for the moment, after some Bearish candle formation appeared yesterday. The lower high and lower low candle formation formed on hourly chart is early sign that April contract may suffer higher downside risk. Most of the Sellers manage to overcome Buying interest when the price made it to 2,342 yesterday. It was a brief rally and turn out to be profit taking activities right after the April contract hit 2,342 level. The long Bearish solid candle signifies there was a lot of Selling pressure right after the market resume on 3pm yesterday and all the way to 4pm. It is a sign that the palm oil futures is likely to go down, but not a definitely it would go down for sure. No one can tell for sure what is going to happen on the next 30 secs, nevermind the next day. Discipline and pro-active risk management is what seperated the novice and informed trader. The novices always think about when and where they can hit the jackpot while an informed trader would always think about how to protect themself each time the positions are entered. If you heard about the old race between tortoise and hare, the odds were against the tortoise but in the end it was the tortoise who won the race. Trading futures or any financial market is a journey, and it will be a long journey to get wise. For today, pivot support for April contract is located around 2,262 while resistance is pegged at 2,331.

Daily Pivot Point
R2= 2362
R1= 2331
S1= 2281
S2= 2262
 Disclaimer: Information and opinions contained in this report are for educational purposes only. While the information contained herein was obtained from sources believed to be reliable, author does not guarantee its accuracy or completeness.

Tuesday, January 20, 2015

FCPO: Its A Swift Selling From 2,394 to 2,300 20th Jan 2014

Tueday, 20th Jan 2015. Palm oil futures has its run down from the peak 2,394 to 2,298 previous Friday and this new weekly break out might not sustain. Other news to follow.

"- U.S. stocks ended the roller-coaster week on a high note, as a rally in oil prices and calmer currency markets provided a rare boost of confidence. The main benchmarks broke a five-day losing streak, but still ended the fourth-straight week with losses. The S&P 500 SPX, +1.34% closed up 26.75 points, or 1.3%, at 2,019.42, but was down 1.2% over the week. The Dow Jones Industrial Average DJIA, +1.10% gained 190.86 points, or 1.1%, to 17,511.57, and lost 1.3% over the week. The Nasdaq Composite COMP, +1.39% ended the day with a gain of 63.56 points, or 1.4%, at 4,634.38, and recorded a 1.5% weekly loss."

"- Chinese stocks dived the most in over six years Monday, with a wide sell-off sweeping across the financial sector as investors turned jittery over the latest move by securities regulators to clean up the margin-trading business. The benchmark Shanghai Composite Index SHCOMP, -7.70%   plunged 7.7% to close at 3,116.35, posting its biggest daily percentage decline since June 2008 . Prior to Monday’s heavy loss, the index was up 4.4% for the month to date, extending gains after finishing 2014 with a sharp 53% advance. The plunge in mainland China helped to push Hong Kong’s benchmark Hang Seng Index HSI, -1.51%  down 1.5%, with the Hang Seng China Enterprises — which tracks Hong Kong-listed mainland Chinese companies — off 5%."

"-Crude-oil futures pushed lower in volatile action during European trading hours on Monday, as another investment bank slashed its price forecasts and investors braced for another week of potential market upheaval. On the New York Mercantile Exchange, light, sweet crude futures for delivery in February CLG5, +2.92%  traded at $48.17 a barrel in recent trade, down 63 cents, or 1.3%, in the Globex electronic session. March Brent crude LCOH5, +0.18%  on London’s ICE Futures exchange fell 52 cents, or 1%, to $49.63 a barrel."


FCPO- No Straight Line Here


Market is full of surprises, at least for my case. There is no telling whenever the trend is coming or it doesn't at all. I am talking about the recent weekly upside break out on FCPO April which made the price break above from previous high at 2,384 level. According to most text book or trend trading manual so to speak, most of these medium term to long term trader would to place their bet if the price manage to break out from certain high. I believe previous Friday break out was at least one week high and those who was targeted to go Long on the next break out would likely went in to Long position. Unfortunately, these types of trade only bring out small percentage of winning ratio. Most of these kind of break out does not rally to the next significant resistance level, example for this case, 2,400 point. What we have now is a heavy profit taking, retracement or whatever you can call it. The fact is, all of the gain made last week was wipe out in a few hours when the April contract strike down to 2,298. It is futile to find out what happen in the background of that drop because market is always evolve and changing. What we can do now, would be charter our next direction, do we bet all out on this retracement or do we wait for further rally to go Long / Short. The best thing to do now will be setting your position to Long at the previous Friday low around 2,300, placing tight stop loss and wait for the market to rally the next hour and eventually hitting the previous high if lucky. If unlucky, we might just cutting loss on a small margin. Vice versa if the market is going up, resistance is pegged around 2,348 for the moment. Set your Short position around that resistance area, place tight stop when your Short position filled and wait. Just wait  until your stop hit or hold overnight if the market is favoring you. That was part of the game plan if you wish to trade in this temporary ranging market.

Daily Pivot Point
R2= 2348
R1= 2326
S1= 2292
S2= 2280

 Disclaimer: Information and opinions contained in this report are for educational purposes only. While the information contained herein was obtained from sources believed to be reliable, author does not guarantee its accuracy or completeness.

Tuesday, January 13, 2015

FCPO: Some Difference In News And External Market 13th Jan 2015

Tuesday, 13th Jan 2015. Palm oil futures manage to recover on late of afternoon session after it retrace gradually on morning and early afternoon session. Soy oil dropped to 32.88 cents per pound or 2% yesterday. Other news to follow.

"-The U.S. stock market ended Monday's session with losses for the second straight trading day, as a renewed sell-off in oil once again hit investor confidence. Energy, technology and financials, which collectively comprise nearly half of the S&P 500, led the losses. The S&P 500 SPX, -0.81% closed down 16.52 points, or 0.8%, at 2,028.29. The Dow Jones Industrial Average DJIA, -0.54%dropped 96.53 points, or 0.5%, to 17,640.84. The Nasdaq Composite COMP, -0.84%ended the day down 39.36 points, or 0.8%, at 4,664.71."

"-Oil futures plunged Monday, with the U.S. benchmark trading below the $46-a-barrel threshold for the first time in nearly six years after Goldman Sachs cut its crude outlook, predicting prices will remain low for a lengthy period. West Texas Intermediate crude oil for February delivery CLG5, -1.52%  fell $2.29, or 4.7%, to close at $46.07 a barrel after trading as low as $45.90. The close was the lowest since April 2009. The move followed a 0.9% loss during Friday’s regular session on the New York Mercantile Exchange. WTI futures are down more than 57% from a June 2014 high of $107.26 a barrel. Meanwhile, Brent North Sea crude oil for February LCOG5, -5.81% the global benchmark, lost $2.68, or 5.4%, to $47.43 a barrel, its lowest finish since March 2009."


FCPO- The Market Is Deciding The Next Path, Hang In There.


Lets get straight to the point, palm oil futures is looking for further recovery as suggested on the longer term chart. Steady higher lows and higher highs can be spotted on hourly chart and these significant candle likely indicate price is positive to rise further. Maybe the right question would be, where would it continue to rise for this week. The answer will always be no one would know for sure, it is the trader's job to make sure he/she is part of that move, period. Most traders would want to relate yesterday substantial surge on afternoon session were likely due to palm oil production that slump about 22% for Dec vs Nov 2014, it was the lowest since 2006. Palm oil slow production was linked to worst flood on the eastern coast and southern part of Malaysia, the catastrophe just stop last week. With such a big dropped in production, it is likely support price from falling too steep, at least for this week. On the negative side, Soy oil for March contract plunge to 32.88 cents from 33.40 cents yesterday. We are going to see lower opening for March contract today, estimating at around 10 points to 20 points lower. Fortunately, the Bears have to work harder to change current Bullish sentiment to short term correction. Today, support level would be place around yesterday low, which is around 2,325 level. Bear in mind that the market might ignore most positive news if the price went down below 2,320 level this week. We are likely to see more correction if the March contract retrace lower than 2,320 level.

Daily Pivot Point
R2= 2397
R1=2379
S1= 2335
S2= 2309
 Disclaimer: Information and opinions contained in this report are for educational purposes only. While the information contained herein was obtained from sources believed to be reliable, author does not guarantee its accuracy or completeness.

Tuesday, January 6, 2015

FCPO: The Journey Is Still North From Here 6th Jan 2015

Tuesday, 6th Jan 2015. Time really flew and today is already the sixth day of 2015. Palm oil futures is believe to heading North for the moment judging from the ability for the benchmark contract to breach slightly above 2,300.

"-U.S. stocks were clobbered Monday in an indiscriminate sell-off triggered by a renewed plunge in crude oil prices and surging dollar, which left the Dow and the S&P with their worst losses since OctoberThe S&P 500 SPX, -1.83%  closed off session lows but still suffered its largest one-day decline in three months. The index also suffered its longest losing streak in a 12-month period, falling for the fourth-straight session. The benchmark index lost 37.62 points, or 1.8%, to 2,020.58. The Dow Jones Industrial Average DJIA, -1.86%  also had its worst down day since October, with 28 of its 30 components closing with losses. The blue-chip index dropped 331.34 points, or 1.9%, to 17,501.65. The Nasdaq Composite COMP, -1.57%  shed 74.24 points, or 1.6%, to 4,652.57, while Russell 2000 RUT, -1.46%  closed down preliminary 15 points, or 1.3%, to 1,183."

"-Mainland Chinese stocks rallied to their highest close in more than five years on Monday, the first trading day of the new year, led by strength in the energy and real-estate sectors. The Shanghai Composite Index SHCOMP, +3.58%  popped up 3.6% to end at 3,350.52, marking its biggest daily percentage gain in a month. In the previous trading session last week, the index also finished higher, ending 2014 as the world’s top-performing major equity market with an annual gain of 52%."
"-Oil futures fell Monday, stretching their losing streak to a third session and hitting their lowest levels in more than five years on concerns over a surging U.S. dollar and nagging worries of growing oil supplies. Light, sweet crude for delivery in February fell $2.65, or 5%, to settle at $50.04 a barrel on the New York Mercantile Exchange. Prices traded as low as $49.77 a barrel earlier in the session. The settlement was the lowest for a front-month crude contract since April 28, 2009. Prices have lost 7.5% over the last three sessions. February Brent on London’s ICE Futures exchange  declined $3.31, or 5.9%, to end at $53.11 a barrel, the lowest settlement since May 1, 2009. Brent has lost 8.3% over the past three sessions."


FCPO- Bulls Next Hurdle, 2,310.


Palm oil futures is running on North side for now despite weaker soy oil price. The most actively traded March contract manage to breached above 2,300 for the first time since early December 2014. Some may agree that recent hiking in palm oil futures is likely linked to bad flood and poor weather condition in Southern and eastern area in Malaysia. That might somehow be true as not only the production is likely to slow down, local logistic system is also affected. Slowing production would eventually reduce stocks level but we still have a great length to expect production to slow down. Majority producers are likely taking advantage of low or zero export tax for the moment and that's explain production level is likely staying unchanged for the next few month. Another reason to cheer for palm oil futures to recover would be seasonal event such as Chinese new year celebration and this event will also slightly increase Soy oil import for China. Back to chart outlook, the March is doing well holding its gain for now, and the next step for further recovery would taking out the previous high at 2,310 level. Unless this event materialize, we are likely to see resilient price action ranging from 2,290 to 2,250 level, at least for this week. Unfortunately, market is likely going back to sideways market if the March contract dive down below 2,200 level. Keep looking for sign of weakness on 30 minutes time frame if the March unable to breach 2,310 level after a few attempt. It will be a good way to abandon Long position by then. For today, pivot point for support is located around

Daily Pivot Point
R2=2308
R1=2285
S1=2250
S2=2238
 Disclaimer: Information and opinions contained in this report are for educational purposes only. While the information contained herein was obtained from sources believed to be reliable, author does not guarantee its accuracy or completeness.

Tuesday, December 30, 2014

FCPO: Flood On Southern Might Support On The Way Up 30 Dec 2014

Tuesday, 30 Dec 2014. Palm oil futures gap up about 1.8% on opening bell yesterday, it was the biggest gap for the past four months. This rally does caught some trader off guard when they are still using sideways /ranging technique to trade last week. Other news to follow.

"- The S&P 500 edged up to another record close on Monday, but the Dow industrials snapped a seven-session winning streak. Utilities, the best-performing S&P sector this year, showed the biggest gain among the 10 main sectors on Monday. The S&P 500 SPX, +0.09% rose by 1.80 points, or 0.1%, to close at 2,090.57, leaving the benchmark up 13.1% for 2014, with two trading sessions left in the year. Monday’s mark also was the index’s 53rd record close of the year, or an average of one a week. The Dow Jones Industrial Average DJIA, -0.09% dipped 15.48 points, or 0.1%, to end at 18,038.23. The blue-chip gauge, up 8.8% so far in 2014, pulled back from a record close achieved Friday. The tech-laden Nasdaq Composite COMP, +0.00%  inched up by 0.05 point to finish at 4,806.91, while the small-cap Russell 2000 RUT, +0.32% tacked on 3.90 points, or 0.3%, to 1,219.11."

"- Hong Kong stocks jumped Monday morning, playing catch-up with the Shanghai markets after returning from a four-day weekend. The Hang Seng Index HSI, +0.34% gained 1.9% after recent reports said China's central bank had changed its rules to allow deposits from non-bank financial institutions to count as reserves, a measure aimed at increasing lending and boosting growth. The Hang Seng China Enterprises, tracking mainland-China-based companies, advanced 4.1%."

"- Gold prices pulled back Monday after some wide swings during Christmas week. Gold for February delivery GCG5, +0.33%  fell $13.40, or 1.1%, to settle at $1,181.90 an ounce on the New York Mercantile Exchange. Silver for March deliverySIH5, +0.55%  also fell, slipping nearly 37 cents, or 2.3%, to settle at $15.78 an ounce."


FCPO- Bulls Are Leaping Ahead. 

Palm oil futures is likely running on positive note after the flood condition on southern Malaysia and east coast are likely to prolong. Current weather condition is likely disturb production and logistic system for the moment. Price is likely supported by the reduced production for final month of 2014 but we are still yet sure whether this rally could turn to be an uptrend. If we are going to expect some steady recovery for palm oil, crude oil and Soy oil have to provide support as well in the longer run. Back to the palm oil technical outlook, we might be looking at continuous rally after the promising break out from two weeks resistance for benchmark March contract, yesterday. There is no telling when will the gap from 2,252 to 2,285 could be fill but if the march contract does open lower or drop lower than 2,284 level, we are likely to see some mild retracement from that level. These gap area will become resilient for the price to adjust up and down, but I am expecting the benchmark March to find support at around 2,250 level this week. Else, if the benchmark March continue to rally from here, there is no telling where is the next resistance will be and yes we might be expecting at least another 100 points rally. For today, pivot support for the March contract is located around 2,276 while resistance is pegged at 2,317.

Daily Pivot Point
R2= 2317
R1= 2301
S1= 2276
S2= 2267
 Disclaimer: Information and opinions contained in this report are for educational purposes only. While the information contained herein was obtained from sources believed to be reliable, author does not guarantee its accuracy or completeness.

Tuesday, December 23, 2014

FCPO: Holiday Mood Until The Early Of Feb ? 23rd Dec 2014

Tuesday, 23rd Dec 2014. Palm oil futures is running on undecided path, moving in and out from week high to week low since early November. Other news to follow. 

"- The S&P 500 and Dow Jones Industrial Average ended Monday at new records, fueled by continued hopes that the Federal Reserve won’t be in a rush to raise interest rates.
The main indexes booked their fourth straight day of gains, abetted by a central bank that last week reassured investors it will be “patient” about the timing and pace of rate hikes. The S&P 500 SPX, +0.38%  gained 7.9 points, or 0.4%, to 2,078.55, closing at a record for the 50th time this year. This is the highest number of record closes in a year since 1995. Gains in technology and telecom stocks outweighed sharp losses in energy and health-care companies. Gains were even larger for the Dow Jones Industrial Average DJIA, +0.87% which rose 154.64 points, or 0.9%, to 17,959.44. The blue-chip index closed at a record for the 35th time in 2014. All but three of its 30 components ended with gains. The Nasdaq Composite COMP, +0.34%  ended 16 points, or 0.3%, higher at 4,781.42."
"-Asian stocks were mostly higher Monday, taking their cues from greater stability in crude oil prices and the Russian ruble, along with the Federal Reserve’s indication it will take a slow approach to raising interest rates. Australia’s S&P/ASX 200 XJO, -0.61%  was up 1.5% to 5420.90 and the Shanghai Composite Index SHCOMP, -1.78%  up 1.2% at 3144.61 as concerns eased over further instability in global market conditions. Japan’s Nikkei NIK, +0.08%  treaded above and below the break-even level, a possible indication that it may be difficult to retain upward momentum after three consecutive gaining sessions in Tokyo last week. At midday, it had edged higher to 17621.66 amid thin trading."

"-Oil prices slumped again on Monday, as comments about maintaining production from several OPEC ministers sparked a renewed selloff. Saudi Energy Minister Ali al-Naimi said the Persian Gulf nation will maintain its oil production and may even increase it if a new client emerges. The comment is the latest signal that the largest oil producer is unlikely to cut production in response to a massive drop in prices. On the New York Mercantile Exchange, light, sweet crude futures for delivery in February   CLG5, +0.69%  gave up earlier gains and settled $1.75, or 3%, lower at $55.38 a barrel. February Brent crude on London’s ICE Futures exchange  LCOG5, +0.27% reversed earlier gains and was trading slightly above $60 a barrel."

FCPO- No Blardy Direction Yet


There is always some direction in the smaller time, but I doubt there is any good direction if you are looking at hourly chart and above for the moment. Most of the trend following indicators are having tough time deciding which one will provide ample return to the position. Ample return would mean enough juice to provide those trend trader at least 100 points profit, at least in my case. A generic trend following indicators may require price to move at least 150 points to 250 points from the trade to turn to be a profitable one. This is because market need to move in line with the break out / break down or after it breached a new high / new low for at least 150 points for the trend following system to pick up the trade and ride it. It is a long shot for most people and choose not to use trend following because of the low hit rate or low winning rate. Most of the trend followers would felt their system is highly tested from November and maybe until the beginning of Feb 2015 as there would be no promising trend to pursuit at that time. Back to the outlook, the March contract is likely open slightly lower today judging on Soy oil weaker price. Range for this week is likely to be 2,190 ~ 2,130 and there is less likely price would move in line even after this range has been broken. In other words, it is unlikely to see any conviction move even if the March contract manage to breach above 2,190 or break below 2,130. Conclusively, market is still trapped in sideways mode this year.

Daily Pivot Point 
R2= 2187
R1= 2178
S1= 2156
S2= 2143
 Disclaimer: Information and opinions contained in this report are for educational purposes only. While the information contained herein was obtained from sources believed to be reliable, author does not guarantee its accuracy or completeness.

Monday, December 15, 2014

FCPO: Painful Range 16th Dec 2014

Tueday, 16th Dec 2014. Palm oil futures end slightly lower yesterday despite some recovery made on Soy oil on Asia trading session. It does not look like decouple but better be alert than sorry. Other news to follow.

"-The U.S. stock market ended Monday’s volatile session lower, as an unabated fall in oil prices continued to erode investor confidence. Traders attributed wild swings in the indexes to a combination of factors, including ‘quadruple witching’ event — the week during which various index futures and options expire, unwinding of large positions by funds and uncertainty surrounding crude oil prices which resumed their slide after a brief rebound. The initial bounce in oil ahead of the regular market open prompted a rally in European stock markets. But as crude fell to new lows, the mood turned gloomy, with major exchanges finishing lower. Dow Jones Industrial Average DJIA, -0.58%  jumped more than 100 points shortly after the market open but ended 100 points, or 0.6%, lower at 17,180.84. The S&P 500’s SPX, -0.63% traded in a 29 point range, but ended 12.60 points, or 0.6% lower at 1,989.63. Utilities and financials were the biggest decliners, while all 10 sectors finished with losses. The energy sector began the day sharply higher, but ended 0.8% lower."


"- Japanese stocks tumbled Monday to their lowest level in four weeks, tracking U.S. losses at the end of last week. The Nikkei Average NIK, -1.72%  declined 1.6% to 17,099.40, its lowest settlement since mid-November. The broader Topix I0000, +0.03%  ended down 1.5%, with the yen USDJPY, +0.07%  rising to ¥118.27 against the dollar from ¥118.83 in the prior session. On Monday, the quarterly tankan survey by Japan’s central bank showed the country’s manufacturers are becoming more cautious about the future. Earlier, Prime Minister Shinzo Abe’s ruling coalition won a majority in the parliamentary elections on Sunday. Most other major Asian markets also suffered losses. Hong Kong’s Hang Seng IndexHSI, -0.95%  lost 1%, extending a three-day losing streak, as a research report from China’s central bank projected the country’s economic growth could decrease to 7.1% next year on slowing property investment. In Sydney, the S&P/ASX 200 XJO, -0.35%  finished down 0.6%, while Seoul’s Kospi Composite Index SEU, -0.61%  dipped 0.1%. However, on mainland China, the Shanghai Composite Index SHCOMP, +0.52%posted modest gains, settling 0.5% higher."

"- Oil bears have had a lot to be joyous about since midyear but it might just be the season to start booking profits on those short bets, Deutsche Bank’s top asset allocation strategist said Monday. In a note, Deutsche Bank’s chief strategist Binky Chadha identified three factors that had led Deutsche to recommend short positions back in June. Those three factors that earlier supported making betting that crude oil prices are on the decline now argue for short covering, he said. Here they are:The overvaluation gap has closed: In June, oil prices were 45% above fair value. Now, even though fair value for New York Mercantile -traded, WTI crude oil has dropped from around $80 to $58 thanks to a sharp rise in the dollar, the large fall in oil futures CLF5, -0.66%  have closed the overvaluation gap (see chart at top of page), Chadha noted. Nymex WTI futures closed Monday at a five-year low of $55.91, down more than 48% from its June high near $107 a barrel."


FCPO- Still Going Nowhere For Trend


Palm oil futures is not making any good sign yet in terms on running on any trend. Less and less sign of where it is going to head next. Export for 1-15th Dec vs Nov 2014 was reported slightly positive with just about 2% to 3% higher. Put the news aside, most of us know medium to long term traders are having very hard time since November 2014 which there is no promising trend to ride. Market quickly return to stubborn range when it hit new high or new low, and it kept repeating this incident more than sixth times in a row. Who to blame ? I rarely sees this is anyone's fault but rather unavoidable market condition that can occur over and over again without us knowing it early on. There is no way to tell either any of the trend trades would work or not, you would just have to execute it and find out. The only we can reduce or minimize losses within this ranging market would be not to trade at all or being super picky about taking a trade and trade significantly less. Other way would be waiting for more confirmation such as going into the trade later than usual, but that also would not stopping any trader from getting losses. A successful trade will be how well that trader can exploits the market condition at that particular time and execute his/her plan due diligently. Back to palm oil futures outlook, we are still travelling within a flexible range within 2,300 and 2,100 for the moment. I doubt the benchmark month would move with conviction after it hit a new high or new low for this year. We will be likely looking at no strong movement throughout until Jan or Feb next year.  For today, pivot support for the new benchmark March will be 2,149 while resistance is pegged at 2,183.

Daily Pivot Point
R2= 2203
R1= 2183
S1= 2149
S2= 2135
 Disclaimer: Information and opinions contained in this report are for educational purposes only. While the information contained herein was obtained from sources believed to be reliable, author does not guarantee its accuracy or completeness.